
18650 vs 21700 Battery Packs: Cost per Wh for OEMs
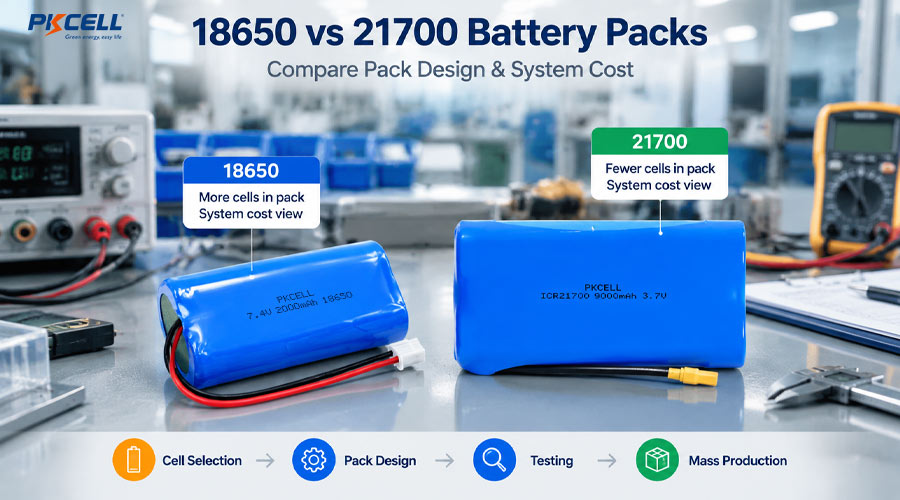
A 21700 cell normally costs more per unit than an 18650 cell, but that does not automatically make a 21700 battery pack more expensive per watt-hour. A larger cell may reach the required energy with fewer cells, welds, holders and assembly operations. At the same time, an established 18650 design may benefit from mature sourcing, existing tooling and a better fit inside a compact enclosure.
OEM buyers therefore need to compare complete, production-ready packs rather than cell price lists. The useful question is not “Which cell is cheaper?” but “Which qualified pack delivers the required usable energy at the lowest total cost and acceptable project risk?”
Why Cell Price Is the Wrong Starting Point
Cell price is visible and easy to compare, so it often dominates early sourcing discussions. However, an OEM purchases a functioning battery system. Each cell must be inspected, matched, positioned, connected, insulated and tested before the pack can be shipped.
Increasing cell count can increase the number of welds, current paths, insulating parts and potential assembly operations. Fewer cells can reduce some of those costs, but the saving is not automatic. A larger cell may require a new holder, enclosure, busbar, welding fixture or thermal design.
The cheapest cell is not necessarily the cell that creates the lowest-cost qualified battery pack.
For initial format screening, review PKCELL’s 21700 battery guide and 18650 comparison. The cost analysis below begins after basic chemistry, voltage, power and dimensional compatibility have been confirmed.
Define Which Cost per Wh You Are Comparing
“Cost per Wh” can describe several different metrics. An apparently favorable quotation can change when the denominator or the cost boundary changes. OEM teams should label the metric clearly in every comparison.
1. Cell Cost per Nominal Wh
This is useful for early sourcing analysis, but it ignores pack hardware, production labor, energy losses and unusable capacity. It should not be the final procurement decision.
2. Pack Ex-Works Cost per Nominal Wh
This captures more assembly cost but still relies on the rated energy printed on the specification. It may not reflect the energy the device can actually use.
3. Landed Cost per Usable Wh
For most OEM sourcing decisions, this is a more meaningful comparison. Usable energy should be measured under a defined load, temperature, voltage window and device cutoff.
4. Lifecycle Cost per Delivered Wh
This metric can include replacement packs, service labor, downtime, warranty exposure and disposal. It is useful for industrial equipment, fleet products and devices where battery replacement is expensive.
Start with Equivalent Pack Requirements
The two designs must solve the same engineering problem. Before requesting quotations, provide both suppliers or design teams with the same requirement set:
- Nominal and operating voltage range
- Minimum usable energy or required runtime
- Continuous, peak and pulse current
- Device cutoff and conversion efficiency
- Charging current, charging time and charger architecture
- Operating, charging and storage temperatures
- Maximum pack dimensions and weight
- Beginning-of-life and end-of-life performance targets
- BMS functions, communication, balancing and protection requirements
- Destination markets and compliance requirements
- Annual volume, ramp schedule and expected program life
If real device consumption varies over time, use a measured load profile instead of a single average-current estimate. Peak loads can change the required parallel count, conductor size and usable capacity even when nominal Wh stays the same.
Calculate the Required Series and Parallel Configuration
For cells of the same nominal chemistry, the required series count is normally driven by pack voltage. The parallel count is then selected to meet energy, current, voltage-sag and lifetime requirements.
Use minimum qualified capacity rather than the most favorable typical value when the project has a guaranteed runtime requirement. Then check whether the resulting configuration meets the load at low state of charge, limiting temperature and the required aging condition.
Illustrative Topology Example
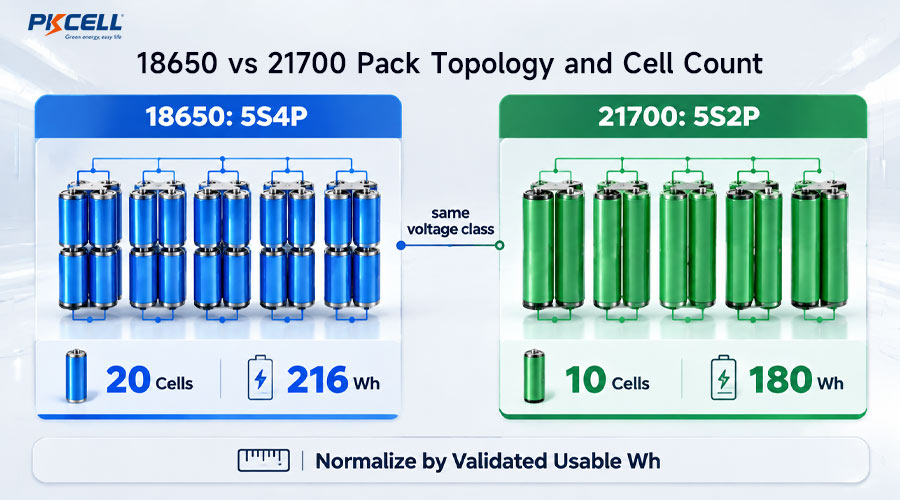
Consider a five-series pack with a minimum nominal-energy target of 180 Wh. Assume candidate A is a 3.0 Ah 18650 cell and candidate B is a 5.0 Ah 21700 cell, both using 3.6 V as the nominal voltage for this simplified calculation.
- 18650 option: 5S4P, 20 cells, 216 nominal Wh
- 21700 option: 5S2P, 10 cells, 180 nominal Wh
The example does not prove that the 21700 pack is cheaper. It shows why cell unit price alone is incomplete: one design uses half as many cells, but it also provides a different amount of nominal energy and may require different structures, current paths and thermal validation.
The final comparison must divide each complete pack cost by its own validated usable Wh. All capacities and prices should come from the exact qualified cell models and current project quotations.
Complete OEM Cost Breakdown
Request an itemized or category-level quotation whenever possible. Even if a supplier cannot disclose every component price, both candidate designs should follow the same cost template.
| Cost Element | How 18650 May Be Affected | How 21700 May Be Affected | What the OEM Should Request |
|---|---|---|---|
| Cells | Lower unit price may be offset by a higher cell count. | Higher unit price may be offset by more Wh per cell. | Exact model, minimum capacity, unit price tiers and approved source. |
| Incoming inspection and matching | More cells may create more measurements and sorting operations. | Fewer cells may reduce handling, subject to the same quality controls. | Inspection method, matching limits, yield assumption and traceability. |
| Interconnects and welds | Higher cell count can require more joints and longer conductor paths. | Lower cell count may reduce joints, but current per cell can be higher. | Material, dimensions, weld count, process and temperature-rise results. |
| BMS and protection | Series count drives monitoring channels; current drives power-stage size. | Often similar for equal voltage, but thresholds and current may differ. | BMS revision, continuous and peak current, balancing and communication. |
| Holder, insulation and enclosure | Smaller cells can support compact or irregular layouts. | Larger diameter may simplify some layouts but increase minimum dimensions. | Production drawing, material specification, tooling and weight. |
| Assembly labor | More cells may increase loading, welding and inspection time. | Fewer cells can reduce operations if automation and fixtures support them. | Cycle time, automation level and quoted annual-volume assumptions. |
| Testing | Capacity, aging and functional-test time may depend more on pack energy and test specification than cell format. | Test coverage, sampling, equipment time and included reports. | |
| Tooling and engineering | Existing 18650 tooling may reduce non-recurring cost. | A new 21700 design may require holders, fixtures or enclosure changes. | NRE, tooling ownership, maintenance, modification and amortization. |
| Packaging and freight | Pack dimensions, mass, state of charge, shipment mode and quantity per carton affect landed cost. | Packed weight, carton dimensions, Incoterm and shipment quantity. | |
| Yield and warranty reserve | The lowest theoretical cost can disappear if production yield or field reliability is weaker. | Yield basis, quality agreement, warranty terms and change-control process. | |
Where a Lower Cell Count Can Save Money
A design using fewer cells can reduce repeated operations. Potential savings may appear in:
- Incoming cell inspection and data handling
- Cell sorting and pack genealogy
- Cell holders, spacers and insulation pieces
- Individual welds or other terminal connections
- Assembly handling and in-process inspection
- Potential defect opportunities associated with repeated joints
These savings depend on the real manufacturing process. A ten-cell 21700 pack is not automatically half the labor cost of a twenty-cell 18650 pack. BMS assembly, enclosure closing, labeling, aging, capacity testing and packaging may take similar time for both.
Interconnect design also matters. PKCELL’s comparison of nickel strip and copper busbars for 18650 and 21700 packs explains why conductor material, dimensions, joining method and allowable temperature rise can change cost.
When 18650 Can Still Have the Lower Cost per Wh
The 18650 format remains commercially relevant because pack economics are application-specific. It may offer the better result when:
- The product enclosure is already tooled around an 18650 layout
- A validated cell and second source are already approved
- Existing holders, weld fixtures and end-of-line programs can be reused
- The pack must fit a narrow, stepped or irregular space
- The energy target aligns efficiently with an available S/P configuration
- Annual volume does not justify new 21700 tooling or certification work
- The application requires a particular qualified high-power 18650 cell
OEMs can review available formats in PKCELL’s cylindrical lithium-ion battery range before requesting a project-specific comparison.
When 21700 Can Deliver Better Pack Economics
A 21700 design deserves closer evaluation when:
- The product needs high energy but has enough diameter and length allowance
- Reducing cell and weld count materially simplifies production
- The selected cell supports the load with fewer parallel branches
- Pack mass or volume per usable Wh is a major product constraint
- The project is new and has no legacy 18650 tooling to preserve
- The annual volume can amortize new holders, fixtures or enclosure tooling
- The supply plan includes a qualified 21700 source for the program lifetime
These conditions are screening factors, not universal rules. Capacity, power and lifetime depend on the exact cell model. A high-energy 21700 cell should not be assumed to provide the same current capability as a power-oriented cell merely because the external dimensions match.
Usable Wh Matters More Than Label Wh
The rated pack energy is calculated from nominal voltage and nominal capacity. The device may receive less because of:
- Minimum rather than typical cell capacity
- Voltage sag under continuous or pulse load
- Device or BMS low-voltage cutoff
- Cold-temperature impedance
- Cell and parallel-group variation
- BMS, wiring and interconnect losses
- Converter efficiency and standby consumption
- Required state-of-charge reserve
- Capacity and resistance changes at end of life
Cell matching can also affect how much of the installed energy remains available before the first series group reaches a protection limit. See PKCELL’s guide to battery cell matching by voltage, capacity and resistance.
Do Not Ignore Topology Rounding
Cells cannot always be added one at a time. A pack must preserve its series and parallel architecture. If the required voltage fixes the series count at ten, adding one parallel branch adds ten cells.
This creates step changes in capacity, size and cost. One candidate may exceed the energy target because the next valid configuration is substantially larger. The OEM then pays for unused energy, additional weight and a larger enclosure.
Compare at least two valid configurations for each format. The lowest cell cost per Wh may lose when topology rounding forces unnecessary installed capacity.
Account for Tooling and Program Volume
Non-recurring engineering and tooling should be amortized across a realistic number of saleable packs.
Use conservative program volume rather than an optimistic lifetime forecast. A new 21700 enclosure may produce attractive recurring cost at high volume but remain more expensive for a short pilot program. Conversely, keeping an inefficient 18650 design solely to avoid tooling may cost more over a long production run.
Request separate quotations for prototypes, pilot production and forecast volume. PKCELL’s custom battery pack service covers cell selection, configuration, BMS, wiring, connectors and mechanical customization.
Compare Lifecycle Cost, Not Just Purchase Price
Purchase cost per usable Wh is appropriate for many consumer products. Equipment with expensive field service may require a lifecycle calculation.
A lifecycle model can include:
- Initial battery pack purchase and inbound logistics
- Qualified cycle and calendar life under the application duty cycle
- Expected usable energy retention at the replacement point
- Technician labor and product downtime for battery replacement
- Replacement-pack shipping, storage and inventory
- Warranty, return analysis and disposal costs
Do not assume that one format lasts longer solely because it is larger. Cycle life depends on cell design, temperature, charge voltage, depth of discharge, current, mechanical conditions and operating strategy. Use test data from the exact candidates.
A Practical OEM Cost Comparison Worksheet
| Input | 18650 Candidate | 21700 Candidate |
|---|---|---|
| Exact cell model and approved source | Enter quotation data | Enter quotation data |
| S/P configuration and total cell count | Enter design | Enter design |
| Minimum nominal pack Wh | Calculate | Calculate |
| Validated usable Wh at required conditions | Test result | Test result |
| Cells, matching and traceability | Enter cost | Enter cost |
| BMS, protection and programming | Enter cost | Enter cost |
| Interconnect, insulation and mechanical parts | Enter cost | Enter cost |
| Assembly, aging and testing | Enter cost | Enter cost |
| Amortized NRE and tooling | Enter cost | Enter cost |
| Packaging, freight, duty and receiving | Enter cost | Enter cost |
| Total landed pack cost | Sum | Sum |
| Landed cost per usable Wh | Total cost ÷ usable Wh | Total cost ÷ usable Wh |
Which Format Should an OEM Choose?
18650 May Be the Better Fit When
- Space is narrow or irregular
- Existing tooling can be reused
- Second-source maturity is important
- Production volume is limited
- A validated 18650 already meets the duty cycle
21700 May Be the Better Fit When
- Higher energy per cell reduces part count
- The enclosure accepts the larger diameter
- A new product permits layout optimization
- Assembly simplification matters at scale
- The selected cell meets power and thermal targets
Neither format wins every cost comparison. The correct choice is the lowest-risk configuration that meets performance, space, compliance, supply and lifecycle requirements at the best normalized system cost.
Request an 18650 vs 21700 Pack Cost Review
Share your voltage, usable-energy target, load profile, dimensions, temperature range, certification markets, sample quantity and annual forecast. PKCELL can compare suitable cell formats and prepare a project-specific battery pack proposal.
Frequently Asked Questions
Is a 21700 battery always cheaper per Wh than an 18650?
No. A 21700 can provide more energy per cell and reduce cell count, but its unit price, tooling, mechanical design, sourcing and production requirements may be different. Compare the complete landed pack cost divided by validated usable energy.
Why not compare battery prices using mAh?
Milliamp-hours do not include voltage. Two packs with the same Ah rating can store different energy when their voltages differ. Use watt-hours for energy comparisons and confirm the usable voltage window.
Does using fewer cells always reduce BMS cost?
Not necessarily. BMS monitoring complexity is strongly influenced by series count, while the power stage is influenced by current, voltage and thermal requirements. Two packs with different parallel counts may still need similar BMS functions.
Should tooling be included in battery cost per Wh?
Yes, when comparing alternative OEM architectures. Divide project-specific engineering and tooling by a realistic number of saleable packs, then include that amount in the total cost per pack.
What information is needed for an accurate bulk quotation?
Provide voltage, usable energy or runtime, continuous and peak current, load profile, temperature range, dimensions, weight, connector, BMS functions, charger, destination market, sample quantity, annual forecast, packaging and delivery requirements.
Conclusion
The 18650 vs 21700 cost decision should be made at pack level. Start with equivalent requirements, build valid S/P configurations, measure usable energy and apply the same cost boundary to both designs. Include the hardware, labor, testing, tooling and logistics required to turn cells into an approved production battery.
A 21700 pack may achieve lower cost through fewer cells and repeated operations. An 18650 pack may remain more economical when it fits the product better, uses existing tooling or benefits from a mature approved supply chain. A transparent cost-per-usable-Wh worksheet makes that tradeoff visible before the OEM commits to tooling or a bulk order.
Post time: Oct-13-2026


