
OEM Lithium Battery Pack Engineering
Cell Internal Resistance: Power, Heat, and Pack Consistency
Cell internal resistance is the hidden parameter behind voltage sag, power loss, heat generation, and uneven behavior inside a battery pack. Capacity tells you how much charge a cell can store; internal resistance helps determine how effectively the cell can deliver that charge under a real load.
When current flows, cell internal resistance causes a voltage drop and converts part of the stored energy into heat. The effect grows rapidly with current because resistive heat is proportional to current squared. In a multi-cell pack, resistance variation can make series cells reach voltage limits at different times and parallel cells share current unevenly. OEM teams therefore need controlled measurements, matched cells, low-resistance interconnects, thermal validation, and production limits based on the actual application.
Internal resistance is not one permanent number printed on a cell. It varies with measurement method, temperature, state of charge (SOC), age, chemistry, cell format, and recent operating history. This guide explains how to interpret it, calculate its first-order effects, and manage cell-to-cell variation when designing an OEM lithium battery pack.
What Is Cell Internal Resistance?
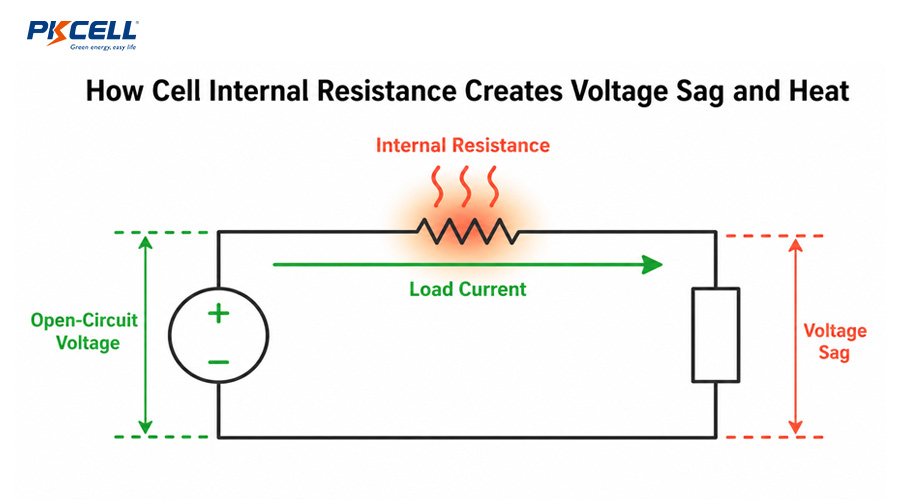
A useful first-order model represents a battery cell as an ideal voltage source in series with an internal resistance. When the cell supplies current, some voltage is lost inside the cell before it reaches the load.
The model is valuable for quick calculations, but a real lithium-ion cell is electrochemical and dynamic. Its impedance includes ohmic effects, charge-transfer behavior, and diffusion-related behavior that appear differently depending on test frequency and pulse duration. Keysight notes that lithium-ion internal resistance depends on factors including temperature, SOC, construction, chemistry, and age. That is why two resistance figures are comparable only when the test method and cell conditions are also comparable.
Cell datasheets may report AC impedance at 1 kHz, DC resistance from a current pulse, or both. For example, the Molicel INR-21700-P42A product datasheet reports AC impedance using a 1 kHz method and DC impedance using a 10 A, one-second condition. Those values describe different responses and should not be substituted for one another.
Internal resistance is a condition-dependent measurement, not a universal identity for the cell.
How Internal Resistance Reduces Available Power
The immediate electrical effect is voltage sag. As load current rises, the voltage lost inside the cell increases. If terminal voltage reaches the device or BMS cutoff during a peak load, the system may shut down even though the cell still contains usable energy at a lighter load.
Consider a simplified cell with 20 milliohms of DC resistance under the relevant test condition. At 10 A, the first-order voltage drop is:
If resistance rises with low temperature or aging, the sag becomes larger at the same current. This can reduce peak motor torque, dim a high-power light, reset electronics, or make the BMS reach an undervoltage threshold earlier.
For high-load devices, cell choice must therefore consider both energy and power. PKCELL’s high-rate lithium-ion battery solutions show the type of applications where discharge capability and thermal behavior deserve as much attention as nominal capacity.
Capacity and internal resistance answer different questions
- Capacity: How much charge can the cell deliver under specified test conditions?
- Energy: How much electrical work is nominally stored?
- Internal resistance: How much voltage loss and heat occurs as current flows?
- Power capability: How much power can be delivered while staying within voltage, current, and temperature limits?
A high-capacity cell is not automatically the best high-power cell. OEM selection should use the load profile, minimum system voltage, pulse duration, thermal environment, runtime target, and end-of-life requirement together.
Why Heat Rises So Quickly at High Current
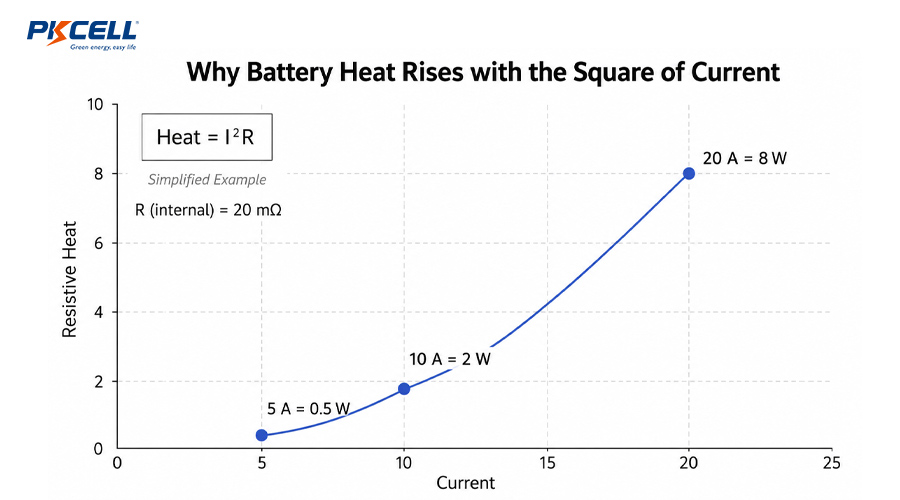
Resistive heat follows the I-squared-R relationship:
Using the same simplified 20 milliohm cell:
- At 5 A: 5² × 0.020 = 0.5 W
- At 10 A: 10² × 0.020 = 2 W
- At 20 A: 20² × 0.020 = 8 W
Doubling current from 10 A to 20 A produces four times the resistive heat in this simplified calculation. The cell’s real thermal response also depends on duty cycle, heat capacity, cooling, spacing, enclosure, neighboring cells, busbars, welds, BMS components, and ambient temperature.
Heat and resistance can reinforce one another in a pack. Temperature changes resistance, while resistance generates heat under load. Aging can increase resistance, creating more sag and heat for the same current. This does not mean any warm cell is defective, but it does mean that temperature rise must be evaluated against controlled baseline data and application limits.
From Cell Resistance to Pack Resistance: A 4S2P Example
Pack-level resistance includes the cells plus tabs, welds, busbars, wires, connectors, fuse, protection MOSFETs, PCB traces, and contacts. A first-order cell-only calculation is still useful for screening.
Simplified 4S2P calculation
Assume eight identical cells, each with 20 milliohms of relevant DC resistance. Two cells are placed in parallel per group, and four groups are connected in series.
Ideal resistance of one 2P group: 20 mΩ ÷ 2 = 10 mΩ
Cell-only resistance of four groups in series: 10 mΩ × 4 = 40 mΩ
At a 20 A pack load: voltage sag = 20 A × 0.040 Ω = 0.8 V
Cell resistive heat: 20² × 0.040 = 16 W across the eight cells
This ideal calculation assumes equal cells, equal-temperature operation, equal interconnect resistance, and even current sharing. It excludes the BMS and every other current-path loss. The production pack should be measured as a system, and critical nodes should be instrumented during representative duty-cycle testing.
If your design is still choosing between common cylindrical formats, review PKCELL’s 21700 vs. 18650 cell comparison. Format can affect packaging and available cell options, but the exact model, resistance method, load profile, and thermal design remain decisive.
How Resistance Variation Hurts Pack Consistency
Series-connected cells: unequal voltage sag
Cells in series carry the same pack current. A higher-resistance cell experiences more voltage sag and generates more heat at that current. During discharge, it may reach the low-voltage threshold before its neighbors. During charging and rest, its behavior may also diverge as temperature, SOC, capacity, and aging interact.
The result can be early pack cutoff, reduced usable energy, localized heating, and faster divergence over life. Balancing can correct SOC differences within its operating limits, but it does not remove a cell’s excess resistance or repair a poor weld.
Parallel-connected cells: unequal current sharing
Parallel cells share a common terminal voltage, but they do not necessarily share current equally. The branch with lower total impedance can initially carry more current. Total branch impedance includes the cell, welds, tabs, busbar geometry, fuse elements, and connection paths.
Unequal current creates unequal heating and cycling. Over time, this can amplify differences between parallel cells. Symmetrical electrical layouts, controlled joining processes, matched cells, and thermal uniformity are therefore essential parts of pack consistency.
Resistance mismatch is not the only mismatch
Texas Instruments identifies capacity mismatch, impedance imbalance, manufacturer variability, and temperature gradients as causes of cell imbalance. For OEM design, resistance should be evaluated alongside capacity, OCV, self-discharge behavior, cell lot, age, and thermal position.
AC-IR, DC-IR, and EIS: Do Not Compare Unlike Measurements
| Method | Basic approach | Best use | Key limitation |
|---|---|---|---|
| AC internal resistance | Applies a small AC signal, commonly at a specified frequency such as 1 kHz | Fast, repeatable production screening when conditions and fixtures are controlled | Does not equal the cell’s full DC load response |
| DC internal resistance | Uses voltage change during a defined current step or pulse | Estimating application-relevant voltage sag over the defined time interval | Result depends strongly on pulse amplitude, duration, SOC, temperature, and timing |
| Electrochemical impedance spectroscopy | Sweeps an AC stimulus across a frequency range | R&D analysis of different electrochemical and ohmic contributions | More complex equipment, analysis, fixtures, and interpretation |
Hioki explains that AC and DC methods measure internal resistance differently and recommends a four-terminal method for accurate low-resistance measurement because two-terminal readings include wiring and contact resistance. For production decisions, use the same instrument class, fixture, frequency or pulse definition, SOC, temperature, rest period, contact pressure, and calculation window.
A practical DC pulse calculation
The measurement points must be defined. An instantaneous value shortly after the current step will not match a value calculated later in the pulse because electrochemical polarization develops with time. Document the exact sampling times so engineering, suppliers, and production teams are discussing the same metric.
Need a pack design reviewed for voltage sag and thermal margin?
Send PKCELL your cell preference, continuous and pulse loads, duty cycle, minimum device voltage, runtime target, available space, ambient range, and charging requirements. The engineering team can evaluate configuration, BMS, interconnects, and prototype test needs.
How to Build a Meaningful Cell-Matching Process
There is no universal milliohm limit that fits every chemistry, model, format, instrument, and application. Establish acceptance limits from the approved cell specification, supplier data, measurement capability, pilot lots, and validated pack requirements.
- Lock the exact cell model and revision. Do not mix models because their resistance happens to look similar.
- Control SOC and temperature. Condition cells to the defined window before testing.
- Specify rest time. Recent charge or discharge can alter the measured response.
- Use a controlled fixture. Apply consistent contact location and pressure with four-wire sensing where appropriate.
- Define the method completely. Record AC frequency or DC pulse current, duration, and voltage-sampling points.
- Measure more than resistance. Include OCV, capacity or relevant performance checks, visual inspection, and traceability.
- Analyze distributions. Review within-lot spread and drift instead of treating one pass/fail number as the whole quality system.
- Retest after assembly. Pack-level measurements can expose weld, busbar, connector, fuse, or BMS resistance that cell screening cannot see.
PKCELL’s custom battery pack service covers cell selection, pack structure, wires, connectors, protection circuitry, and application-specific engineering. Those elements should be included in the resistance budget from the start.
Design Practices That Improve Pack Consistency
- Use qualified cells from controlled lots. Maintain model, revision, supplier, date-code, and lot traceability.
- Design symmetric parallel paths. Avoid branch layouts that create systematically different conductor resistance.
- Control the joining process. Monitor weld quality and inspect for abnormal connection resistance.
- Reduce thermal gradients. Consider cell spacing, airflow, heat spreaders, enclosure materials, and nearby heat sources.
- Coordinate BMS thresholds with sag. Protection must tolerate legitimate transients without allowing damaging operation.
- Place temperature sensors using test evidence. The easiest mounting location may not be the true hot spot.
- Validate at end-of-life conditions. Repeat critical load and thermal tests with aged cells or justified aged-cell models.
- Control changes. Reassess performance when cells, weld settings, interconnects, firmware, connectors, or enclosure details change.
For available configurations and pack-level customization, explore PKCELL’s OEM lithium-ion battery packs and broader rechargeable battery product range.
Common Internal Resistance Mistakes
- Comparing AC-IR from one datasheet with DC-IR from another
- Comparing measurements taken at different SOC or temperatures
- Using a two-wire handheld reading as a precise cell acceptance result
- Ignoring fixture, lead, contact, weld, busbar, and connector resistance
- Assuming every cell in a parallel group carries exactly equal current
- Using beginning-of-life resistance for end-of-life power calculations
- Setting BMS undervoltage thresholds without analyzing transient sag
- Specifying a resistance limit without defining the test method
- Trying to correct high resistance with balancing
- Approving a cell without testing the complete production-intent pack
What OEM Teams Should Send to a Battery Pack Supplier
A supplier can evaluate resistance and power requirements more accurately when the inquiry includes:
- Continuous current, peak current, pulse duration, and repetition rate
- Device operating-voltage range and transient reset threshold
- Runtime target at beginning and end of life
- Charge current, charge time, and use-while-charging requirements
- Operating, charging, and storage temperatures
- Mechanical envelope, weight target, and expected cooling conditions
- Series/parallel preference or required system voltage
- Connector, cable length, BMS communication, and fuse requirements
- Expected annual volume, prototype schedule, and target markets
- Required transport, safety, and product certifications
Frequently Asked Questions
Is lower cell internal resistance always better?
Lower resistance generally reduces sag and resistive heat under the same current, but it is not the only selection criterion. Capacity, chemistry, safety limits, cycle life, size, cost, sourcing, temperature performance, and application restrictions must also match the product.
Why does the same cell show different resistance readings?
Results change with AC versus DC method, frequency or pulse timing, SOC, temperature, rest time, contact quality, fixture resistance, instrument accuracy, and cell age. Control and record these conditions before comparing readings.
Does internal resistance increase as a lithium-ion cell ages?
Resistance commonly increases as cells degrade, but the rate depends on chemistry, temperature, SOC history, charge and discharge stress, storage, and measurement conditions. Track resistance together with capacity and application performance.
Can a BMS fix resistance mismatch?
No. Balancing can adjust SOC differences within its designed capability, but it cannot remove internal cell resistance or repair a high-resistance interconnect. Abnormal resistance requires diagnosis and appropriate cell, process, or hardware action.
Should cells be matched only by internal resistance?
No. Cell matching should consider the approved model and lot, resistance under a defined method, OCV, capacity or relevant performance, self-discharge behavior, age, and traceability. The complete pack still requires electrical and thermal validation.
Conclusion: Manage Resistance as a System Property
Cell internal resistance connects electrical performance, thermal behavior, efficiency, and pack consistency. Use it to predict voltage sag and heat, but never treat it as a fixed number independent of test conditions. Control the measurement method, match qualified cells, design uniform current paths, reduce thermal gradients, and measure the assembled pack under its real duty cycle.
Develop a More Consistent Custom Battery Pack
Share your load profile, voltage limits, operating temperature, enclosure, runtime, charger, connector, volume, and compliance needs with PKCELL. Our team can help translate those requirements into cell selection, pack configuration, protection, and prototype validation.
Post time: Aug-06-2026


